
How to do a bulk Core Web Vitals audit as a non-developer
Google’s Core Web Vitals update, rolling out summer 2021, is considered a big deal in SEO.
Google now uses three new metrics to evaluate page speed – how quickly the largest asset of the page loads, how stable the viewport is while loading and how quickly components respond to first interaction.

These metrics are named Largest Contentful Paint, Cumulative Layout Shift and First Input Delay.

In terms of what hurts these metrics:

You can read more about the specifics of the individual metrics and performance thresholds at web.dev.
Google, as is its wont, does not make it easy for you to get complete diagnostic data with recommendations for how to improve your metrics.
Google Search Console gives you aggregated data, sorting pages into three categories – Poor, Needs Improvement and Good.

However, GSC on its own falls short of the mark as it:
- Only gives ratings on pages that have had enough traffic from opted-in Chrome users to collect data. For a large site, this could omit a significant number of pages and Chrome may not be the most popular browser to your site.
- Tells you the extent of subpar performance, but not how to fix it. If you try to get recommendations, GSC sends you to another tool, PageSpeed Insights, where you have to manually input each URL.
There are other options to get data on performance along with recommendations, such as Google Lighthouse, (available in Chrome DevTools) and web.dev. Unfortunately, these all do so on a page-by-page basis, with no simple way of doing it in bulk.

And if you have a site with 10k+ pages, who has time for that?
Turning to the Dev Side
I am not a qualified developer, though I do dabble. If you work in SEO, your job is part marketing, part content strategy, part copywriting, part analyst and part developer.
I have a good understanding of HTML and some CSS and Java, but I do not claim to be, nor do I particularly want to be, a full stack developer.
Most developers I know are aware of Google’s ever-changing demands (Structured Data, pls), but few are willing to go through the hassle of learning about Core Web Vitals, let alone running tests to diagnose problems. They typically have their priorities set by Product Owners, line managers and so on.
We need to be able to make Core Web Vitals one of those priorities. The best way to do this is by breaking down the extent of the problem and fixes required as succinctly as possible.
Besides, as an SEO professional, you want access to this data frequently and effortlessly. Being able to self-serve means you are going to be less of a burden to your developers.
Enter Screaming Frog
First, download the Screaming Frog SEO Spider. If you work in SEO, you will no doubt use this or a rival tool daily. I’ve used SF since its first iteration in 2010 and is as essential to SEO as chicken is to KFC. If you are unfamiliar with it, it mimics bots like Googlebot, crawling pages on your site through links, extracting the information you ask of it.
If you are working on a larger site, you will need a license to crawl a site over 500 pages or change any of the basic settings, so get one of those as well. It’s well worth the annual £180.
Second, create a Google PageSpeed Insights API key. We are looking to make Screaming Frog run PageSpeed Insights tests on each URL individually, then download the diagnostic data in bulk.

Once your key is created, give Screaming Frog access by selecting the following from the main menu: Configuration > API Access > PageSpeed Insights.

Now, for a clean list of URLs
In order for Screaming Frog to access the API, it needs to first establish all the healthy URLs that return a 200 OK response code, then submit them for testing through the API.
Technically, you can ask Screaming Frog to run a live crawl, after which it automatically submits healthy URLs through the API. This, however, can be problematic if you have a number of redirecting and broken links, which is common on a larger site.
This adds time to the process, increasing the likelihood of the API timing out, which requires a re-crawl of timed-out URLs. It also means you’re potentially missing URLs, as Screaming Frog does not automatically submit redirected destination URLs to the API.
So first, compile a list of all clean URLs by doing a crawl on the live site, de-duping pages with tracking, pagination and filtering parameters, then adding any destination URLs from redirects.
For my working example, I have chosen to run the Core Web Vitals test on oda.com.

It is a quick commerce site selling groceries online, recently valued at over $1bn with investment from Softbank.
They’ve migrated from their old domain (kolonial.no) in May 2021 and the new site has a respectable 12,387 pages. As they are looking to expand into new markets in Europe, their site is likely to grow even further as new country content will be added in local languages.
As with any site of this type, issues of index bloat are one of the most important things to fix, but that’s a discussion for another time.
Configuring the data
There are a lot of options for data to download through the API.

These are your options:
Overview
This extracts some overview data of each page (obviously) with the most important being total size savings in terms of bytes and seconds. Leave this one ticked.
CrUX Metrics
This shows your Core Web Vitals assessment based on ‘field’ data from opted-in Chrome users in the last 28 days. This is provided both for each page and the domain as a whole (or origin as it’s called here).
This data is based on the 75th percentile of users, meaning 75% of users have experienced these Core Web Vitals ratings or better.

This is what Google uses to rate your page experience on, so these are ultimately the scores you need to improve. Because of how the data is collected, metrics take at least 28 days to update, so please be patient.
This data may not be available for every page on your site because they have not received enough visits from opted-in Chrome users. If so, you will need to go by ‘lab’ or Lighthouse Metrics, which is the next option. If this is missing for a lot of pages, you could opt to not collect this data, as it adds time to the API crawl and leaves you with an excessive number of blank fields.
You can get a good understanding of whether or not you can get meaningful field data by checking the Core Web Vitals section of your Google Search Console account. If there’s a big disparity between the number of pages included here and your clean list of URLs, you’ll be relying more on lab data.
For Oda, only around 100 of the 12,387 pages I submitted had CrUX metrics, which makes sense, given how new and large the domain is. Therefore, we will focus more on lab metrics.
Lighthouse Metrics
This shows you ‘lab’ data from Lighthouse and is what your performance metrics, including recommendations from PageSpeed Insights is based on.

This data uses a throttling internet connection on desktop and a Moto G4 device (released in 2016) and throttling 4G connection for mobiles.
This data should be available for every page, though time-outs or server issues may necessitate re-crawls.
Lab data is typically worse than field. Where this isn’t the case, it’s mostly due to user devices or behaviour. For example:
– Popular devices can be different enough to the Moto G4 to have a different asset recorded for LCP, thanks to a different viewport. Your hero banner may be off-screen on the 5.5 inch Moto G4 and therefore not used for LCP. For actual users on the latest iPhone Pro Max, it is.
– User interaction being impossible to predict. CLS lab data is limited to above the fold and initial page load. If you have a long page that lazy loads iframes or images without specified dimensions, user scrolling will add to the layout shift recorded.
It would be great if Google would allow different devices and speeds for Lighthouse. Chances are that you have access to some sort of analytics tool to see which device type is most common. Apple doesn’t pass on model type, but you can get a good feel for this based on screen size. But, here we are. Maybe this rigidity is there so you design journeys with worst-case in mind.
Because lab data uses a single set of variables, it allows for quick debugging. Changes you make will improve Lighthouse metrics instantly. At the same time, because this data is not based on actual site users and may not even be representative of them, Google won’t be using this to base rankings off.
It’s all very typical Google behaviour.
Because there’s no human interaction to measure input delays, First Input Delay is replaced here by a proxy called Total Blocking Time (TBT). This is based on when the browser’s main thread is blocked long enough to prevent responsiveness. KPIs for it can be be found on web.dev.
Opportunities
This is the main thing we want to collate from this API – specific recommendations on how to improve Core Web Vitals and total page load times. Make sure you leave this one ticked! I think the default metrics are fine.
Diagnostics
These are less important – but still important – recommendations on how to get Core Web Vitals and total page load speed times. Tick this one.
Unfortunately, you will need to do one crawl for mobile numbers and one for desktop, so buckle up and be prepared to do this twice through the awesome power of Screaming Frog. Core Web Vitals will initially only apply to mobile results, but regardless, it is important to understand the discrepancy between mobile and desktop performance, as your visitors likely use both.
Making sense of the results
Once you’ve finished the crawl of the site, export the results for individual pages into a spreadsheet.
I tend to then fill in fields green, amber and red based on the Core Web Vitals standards. It allows for an easy read of the general trend for each page.
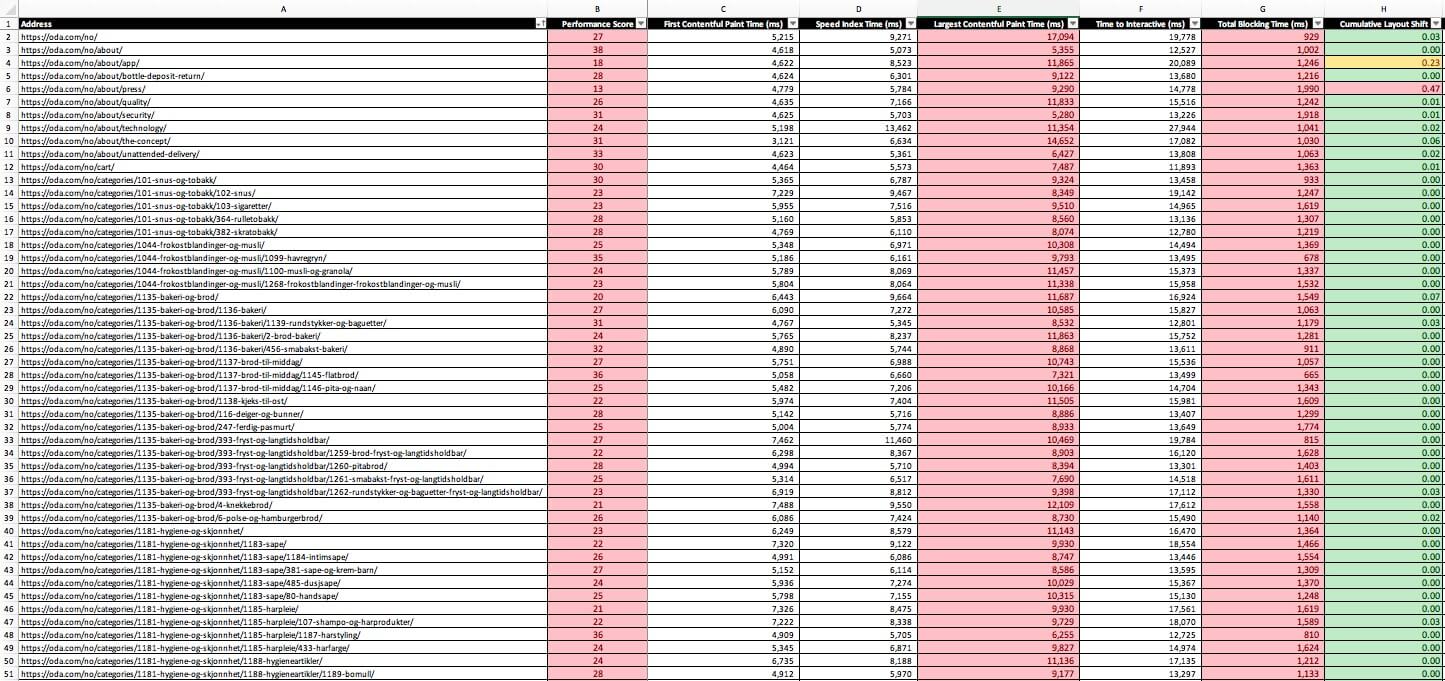
You can then also visualise this data in easily digestible infographs like pie charts to share with stakeholders.

The lab data is likely to be less flattering than the field data you can see in Google Search Console. You will also likely see better results on desktop than mobile in an aggregate.
Now we need to quantify the improvements possible succinctly. Look at the overview tab in the top right corner. Export a summary of these by selecting the following from the main menu: Reports > PageSpeed > PageSpeed Opportunities Summary.
You should have a summary sheet that looks something like this:
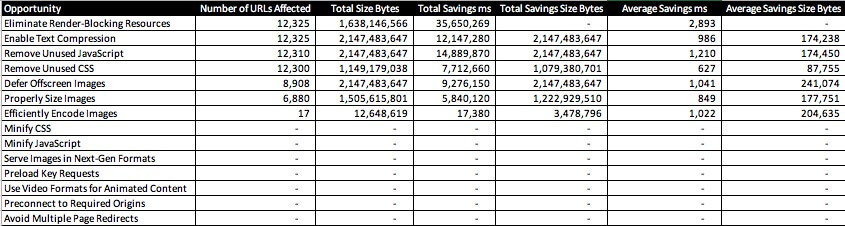
In this case, there’s no CSS or Javascript to minify, no dated image types and so on. That’s great, but we do have other problems – Unused CSS, JavaScript and images that are too large.
Please note that, because I have used a clean existing list of URLs, there won’t be multiple redirect recommendations. That’s fine, as I prefer to deal with multiple redirects separately.
What you know about rolling down in the deep?
Export the different issues into separate tabs to highlight where improvements can be made. Pages that are part of a large site likely share templates, which in turn likely share components, meaning that a recommendation that applies to one page likely applies to many.
This is the key benefit of using Screaming Frog – we can identify recommendations for improvements and quickly see where these apply to the rest of the site.
For example, looking at Eliminating Render-Blocking Resources shows that this problem is caused by only 4 resources, but is applicable to the totality of 12,300 pages. Therefore, this is a relatively “simple” fix that has wide-ranging impact.

Please remember that the impact that these improvements will have for your users will differ from what Lighthouse reports – the lab data is from a controlled environment with one device and one connection type. Nevertheless, the recommendations remain.
Google has provided documentation on why a particular issue is detrimental to one or more of the Core Web Vitals and what can be done to fix it, which can be accessed here. I would strongly recommend you try to understand these as best you can before reaching out to developers and other colleagues.
A path ahead appears
Once you have the output of the Core Web Vitals audit with the opportunities to improve them defined, it’s time to engage with developers, POs and other stakeholders.
In the past, I have failed to get recommendations added to developers’ work stacks because I would simply download individual page recommendations or create links to PSI test results and send them on.
By presenting changes and how they can be applied in bulk, you have a much stronger case for making changes and the impact they will have on speed.
Some of the changes you present will not be possible.
For example, Google may say that a page contains unused JS and CSS, but your developers may reply that those are necessary for your website to have a functional CMS with a WYSIWYG editor.
Others, such as properly sizing images in the right dimensions, compressed to an acceptable quality, should be more straightforward.
Sometimes, things may have been done in a way that made sense to developers. They may have consciously front-loaded a lot of JS/CSS, thinking that it makes subsequent visits faster through browser caching.
While this is technically true, it’s not great for SEO and is also off-putting for new visitors. Depending on how often your users return to your site, it may not be a big win doing so in the first place. This is where you have to educate your developers about the wonders of SEO and analytics on user behaviour.
The important thing is to highlight each opportunity and engage with your stakeholders to fully understand the art of the possible.
We also need to be able to highlight the benefits of doing this to the business.
Speed is money
As people who work in SEO, we are often guilty of not remembering when we are dealing with people outside of our faith.
For us, doing something because it will improve Google rankings and is the right thing to do for visitors is reason enough.
We believe in the Holy Trinity of Google Search, YouTube and Maps. They exist on the screen that our customers keep on their person at all times and check an average of every 12 minutes throughout the day. How could you need more justification?
Sadly, some people we deal with, such as senior stakeholders and executives, don’t share our creed. Some don’t care about Google that much or even at all. I have had this said to my face many times. It really hurts.
Therefore, it is important to emphasise that these changes will not only help search rankings and traffic to your site, but also the page speed for every visitor. This, in turn, creates a better user experience and improves every task completion metric, from sign-ups to servicing.
Predicting the ranking improvements from this work will rely on fuzzy logic and assumptions. Anyone who has worked in this field long enough knows that your changes do not happen in a vacuum. Your competitors’ actions and algorithm updates put a spanner in the works.
No matter. As humans, we prefer a bad theory to no theory. I’ve seen this to hold true, where predictions have been made for projects, releases or other work that never came to pass, but at least the work got done.
I’ve also rarely seen colleagues be held accountable for their predictions and reprimanded if they weren’t completely accurate. If this happens to you, let your stakeholders know that Google works in mysterious ways.
How to start telling the story
First, benchmark yourself against your peers. Different industries have different averages, independent of what Google thinks of as good. This can often be more of a selling point than Google’s ratings alone.
So, repeat the extraction of Core Vitals Data on your competition to get a summary of ratings and individual pages and do a like-for-like comparison.
I should note Google lets you create CrUX dashboards based on field data: https://g.co/chromeuxdash. These can be very powerful in creating graphs of the current situation and trends for you and your competitors, but do note these graphs are based on users, rather than pages. The limitation of field data also applies here.

Second, look at the KPIs for your business and think about how an increase in speed will help each one. Better rankings will lead to more generic traffic, but how many of those visitors can you currently see on an initial or returning visit suffer long loading times for registration or sign up pages? How many of your existing customers have to sit through a jumpy login page on mobiles?
Third, the impact on your rankings is going to be more dramatic the further away from Good your pages are. Someone I spoke to made the point that the importance of Core Web Vitals is overblown. He opined that, if someone wants your product, it doesn’t matter if your pages take 2.5 seconds to load or 2.9. That’s likely true, but for oda.com, the homepage took 19 seconds to load fully in Lighthouse and 9 seconds for me using an iPhone X on a 4G connection. Every second shaved off here is going to be a big deal.
If need be, a pilot case study of key landing pages can be done as a proof of concept before work is rolled out to the rest of the site.
My experience is that shifts in rankings become more noticeable when page performance moves between categories, e.g. from Poor to Needs Improvement or from Needs Improvement to Good, whereas movement within any of these categories have less of an impact. Keep the faith as improvements take place.
Let me get on my soap box for a bit
There are other, less manual ways to get Core Web Vitals performance and debugging data, but these are beyond the capacity of a non-developer like me and/or require paying for tools you may not have the budget for.
Hence why this article exists in the first place.
Developers are given guides by Google on how to measure web vitals in the field, why field and lab data are different and how to debug web vitals with GA4 and Data Studio. I would strongly advocate you read all of these, even if things get too complicated.
The Chrome Developers YouTube channel also offers great videos I would recommend you watch:
The problem is, if you’re not a developer or responsible for your analytics tagging, you probably don’t have the necessary tools, access or skills to act on these recommendations in your current job.
Dashboards like this would be ideal for you to show the extent of current speed issues and get buy-in to fix them. For many working in SEO, they will remain a dream:

Besides, if you’re SEO professional, you have many other areas to focus on – content gap analysis, redirect chains, link building, competitor analysis and ranking reports. All things not closely related to this. The responsibility of Core Web Vitals shouldn’t be placed on your shoulders alone, though it often is.
Developers I’ve worked with are typically busy elsewhere and don’t care about page speed beyond their own experience, unless told otherwise. That’s the honest truth. If your developers have been different, I’m jealous and, in future, I hope to be proven wrong.
To use a mantra one of my good friends taught me: You are not your user. If you’re at your work station, using a high spec MacBook, WiFi and a browser with cached assets from previous visits, it’s easy to develop a biased impression of how fast your pages are. This goes for developers as well as other internal employees.

Google elsewhere suggests you use third party tools to debug and optimise Core Web Vitals.

These are, of course, not free.
So, if you want to go down this path, you have to onboard third party vendors. That’s often not feasible for small businesses, or even big organisations, where the supplier tender process is long and far out of the control of a lowly SEO professional.
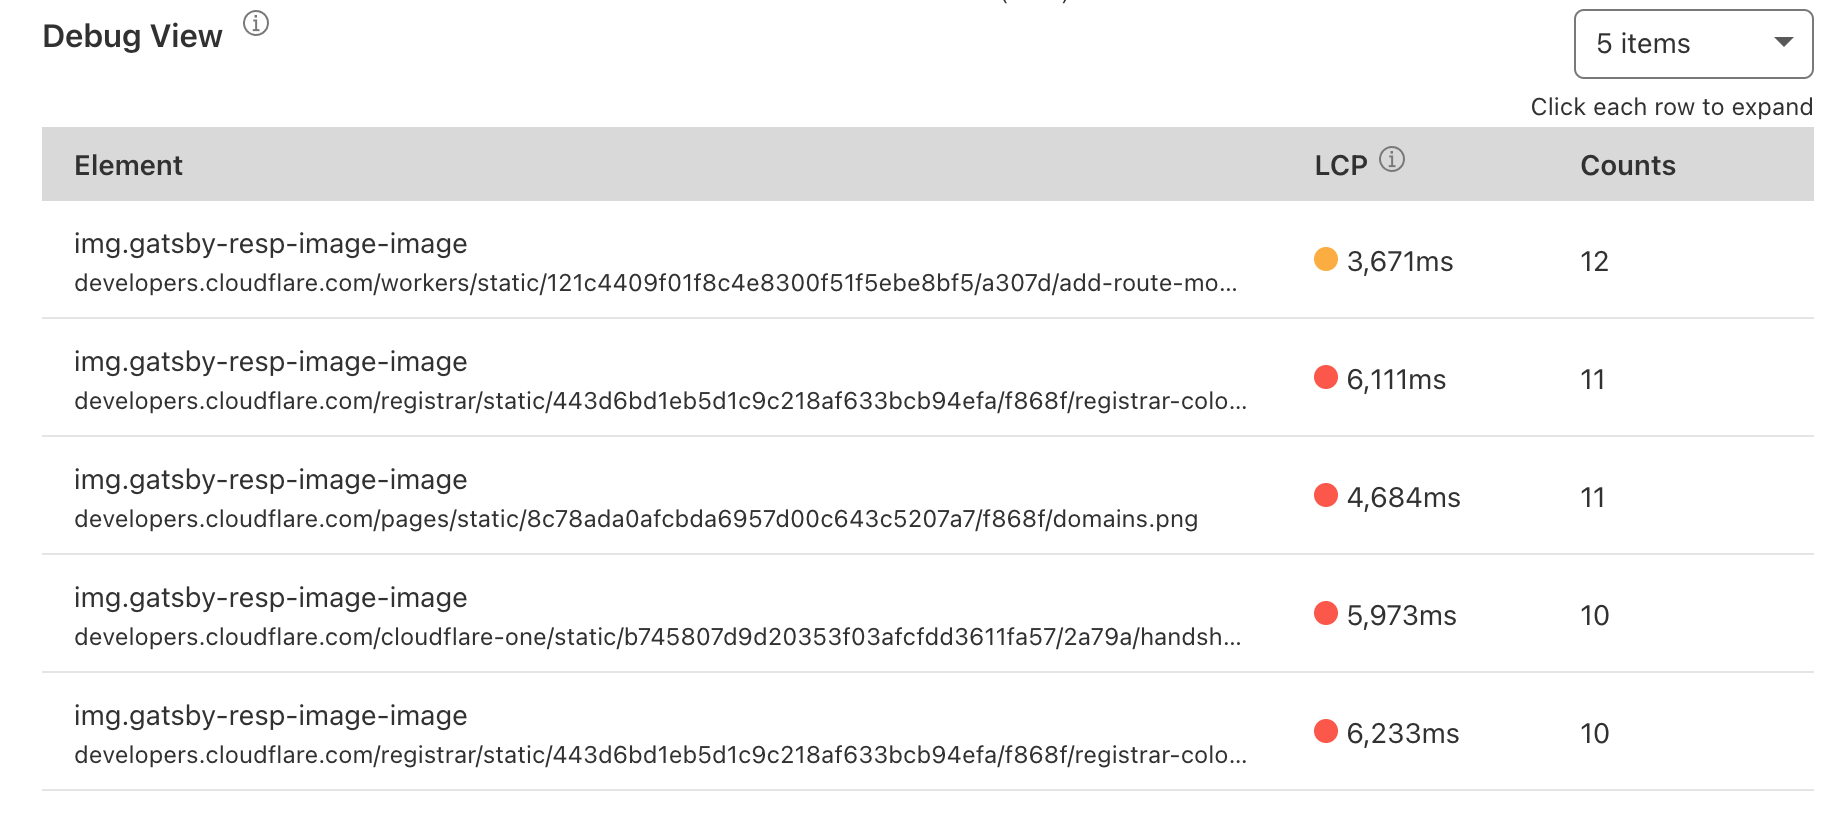
The above screenshot is from Cloudflare and gives an example of debugging data on field users.
Similar to the GA4/BigQuery/Data Studio integration, this is exactly the kind of information you would want to get buy-in to improve Core Web Vitals for your website. So just convince your finance department to shell out for an enterprise cloud network solution to get the metrics essential to your job. It’s THAT simple.
Google does what Google wants
This is all very typical Google behaviour – they announce something new and shiny, tell you it’s important and then leave you to figure things out by yourself.
This happened with Google Tag Manager and Schema.
Right now, it’s happening with Core Web Vitals and GA4.
I’m sure speakable schema markup will become equal parts essential and painful to implement in future.
What are you going to do, focus on Bing instead?

Back to our scheduled programming
Ok, temper tantrum over.
Hopefully this article has given you a good place to start recording, debugging and improving Core Web Vitals using Screaming Frog and a PSI API key. Who knows, maybe after you improve yours enough, you can get the buy-in internally to integrate CWV with your analytics software and really make a difference.
Good luck in pushing your changes through and if you have anything to correct or add, please feel free to drop me a line and I will amend this article.
Until next time, take care and stay safe.